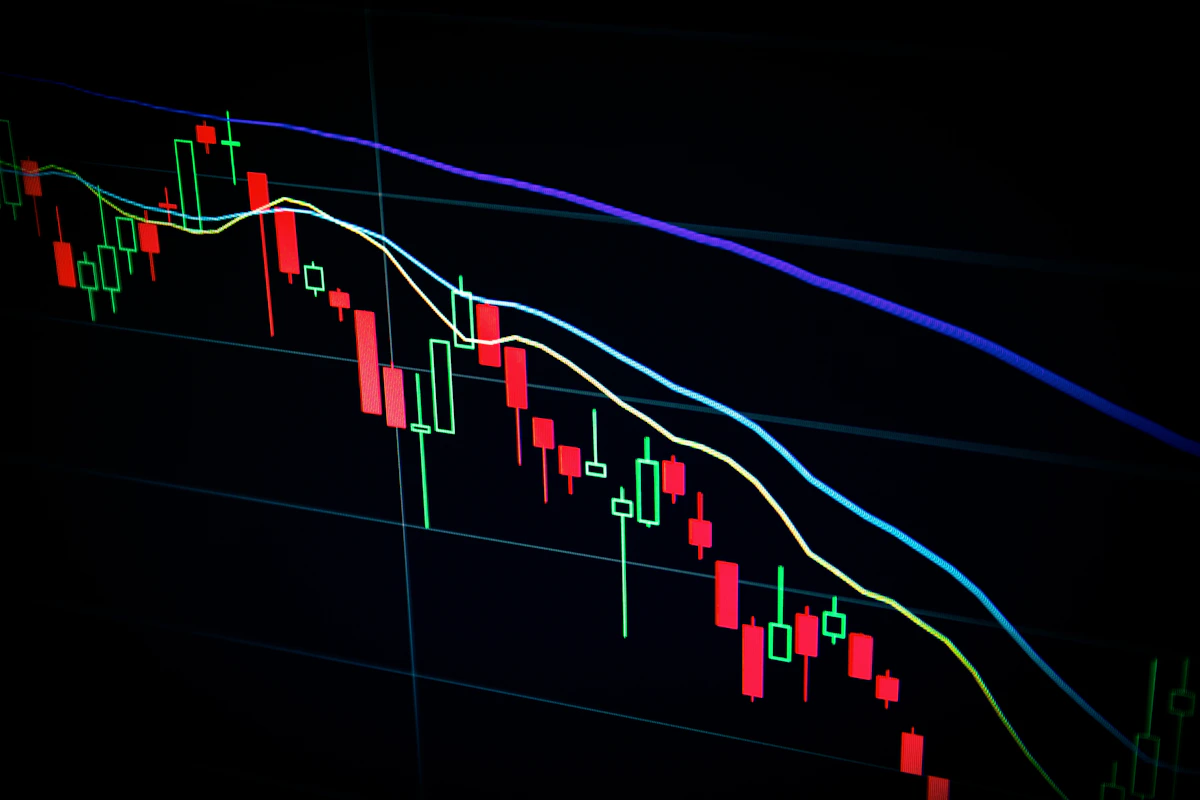
The Commodity Supercycle Framework: Historical Patterns and Current Positioning
Using historical supercycle data to position portfolios requires understanding both the structural drivers and the typical duration of supercycle phases. This analysis provides the framework for applying historical patterns to current market positioning.

Commodity supercycles are multi-decade phenomena driven by structural shifts in demand that outpace the supply response for extended periods. Identifying where we are in the current cycle — and positioning accordingly — requires both historical pattern recognition and an understanding of the specific structural drivers at play.
HISTORICAL SUPERCYCLE ANALYSIS
Economic historians have identified four completed commodity supercycles since industrialisation: the 1890s US industrialisation cycle (approximately 1887-1897); the 1930s-1940s WWII rearmament and reconstruction cycle; the 1960s-1970s global industrialisation cycle (particularly Asia ex-Japan); and the 2002-2012 Chinese industrialisation cycle.
Each cycle followed a broadly similar pattern: an extended period of rising prices as demand growth outpaced supply response; a period of supply investment and capacity buildup in response to high prices; a transition to declining prices as new supply came online; and an eventual trough as excess capacity was worked through.
The average duration of each cycle phase varied: rising phases lasted 10-16 years on average; peaks were relatively sharp (typically 1-3 years); declining phases lasted 6-12 years.
CURRENT CYCLE POSITIONING
The structural case for the current potential supercycle — energy transition demand driving extraordinary growth in metals requirements — has been outlined extensively in our previous research. The key question for market positioning is where we are in the cycle timeline.
Our assessment: the current cycle is in its very early stages. The energy transition investment cycle began in earnest only around 2020; supply investment in critical minerals has been inadequate relative to what IEA demand scenarios imply; and many of the demand drivers (EV penetration, grid investment, hydrogen) are still in exponential growth phases rather than maturity.
SIGNALIX COMMODITY PORTFOLIO POSITIONING: Maintain long copper (highest conviction), uranium, and silver as the three primary energy transition metal positions. Supplementary positions in rare earths and lithium for investors with higher risk tolerance.
Our editors curate the most important stories every morning. Join 50,000+ professionals who start their day with Signalix.
No spam. Unsubscribe any time.
Signal Desk at Signalix delivers expert analysis and breaking coverage across global markets, trade intelligence, and business strategy — combining deep industry expertise with rigorous reporting standards to provide actionable intelligence for business leaders worldwide.