The Complete Guide to Technical Analysis in Commodity Markets
Technical analysis — the study of price charts and volume data to identify trading opportunities — remains one of the most widely used analytical approaches in commodity markets. Understanding its principles and limitations is essential for any serious market participant.

Technical analysis is one of the most debated topics in finance. Its advocates point to the empirical reality that price patterns repeat, that markets have momentum, and that understanding crowd psychology through price and volume data is genuinely informative. Its critics note that most technical signals have been arbitraged away by algorithmic traders and that the theoretical foundation is shaky.
The pragmatic view, which most experienced commodity traders hold, is somewhere between: technical analysis is a useful tool for managing trade entry and exit points, identifying important price levels, and understanding market sentiment — but it is not a reliable standalone trading system, and it performs best when combined with fundamental analysis.
Price Charts: The Foundation
The foundation of technical analysis is the price chart, which records the market's historical trading activity. The most commonly used chart types in commodity markets are:
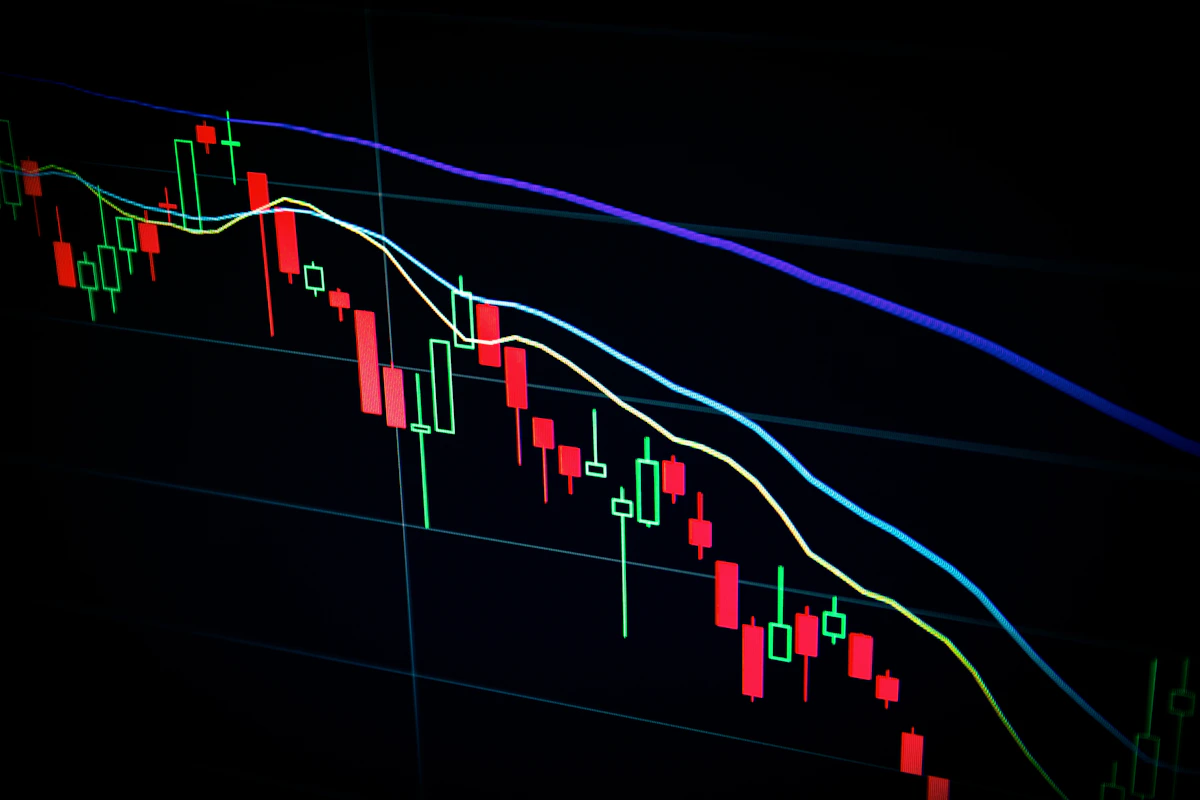
The candlestick chart, which shows the opening price, closing price, high and low for each time period in a single visual element. The body of the candle shows the range between open and close; the wicks show the high and low. Candlestick patterns — doji, hammer, engulfing patterns, shooting star — provide information about the balance of buying and selling pressure in any given period.
The bar chart, which similarly shows open, high, low, and close but in a less visually intuitive format that is nonetheless widely used in professional contexts.
Support and Resistance: The Core Concepts
The two most fundamental concepts in technical analysis are support and resistance.
Support is a price level at which buying pressure has historically been sufficient to halt a price decline and reverse it higher. When price falls to a support level, experienced buyers recognise the level as an attractive entry point, creating the self-fulfilling dynamic that gives support levels their significance.
Resistance is the mirror concept — a price level at which selling pressure has historically been sufficient to halt a price advance. The psychological significance of round numbers (gold at $2,000, oil at $100) creates natural resistance levels.
Moving Averages and Trend Identification
Moving averages — which calculate the average price over a specified number of periods, updated on each new price bar — are among the most widely used technical indicators. The most significant moving averages in commodity markets are the 50-day, 100-day, and 200-day moving averages, which represent approximately 2.5 months, 5 months, and 10 months of trading history respectively.
Our editors curate the most important stories every morning. Join 50,000+ professionals who start their day with Signalix.
No spam. Unsubscribe any time.
Signal Desk at Signalix delivers expert analysis and breaking coverage across global markets, trade intelligence, and business strategy — combining deep industry expertise with rigorous reporting standards to provide actionable intelligence for business leaders worldwide.